Skewness Definition In Statistics
adminse
Mar 28, 2025 · 7 min read
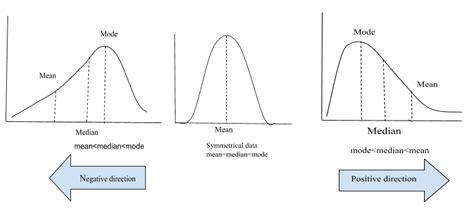
Table of Contents
Unraveling Skewness: A Deep Dive into Statistical Asymmetry
What if understanding skewness unlocks a deeper understanding of data distribution and its implications? This fundamental statistical concept is crucial for accurate data interpretation and informed decision-making.
Editor’s Note: This article on skewness in statistics was published today, offering current and comprehensive insights into this vital statistical concept. It provides a detailed explanation suitable for students, researchers, and anyone seeking a thorough understanding of data asymmetry.
Why Skewness Matters: Beyond the Bell Curve
Skewness, in statistics, measures the asymmetry of a probability distribution. Unlike symmetric distributions like the normal distribution (the classic bell curve), skewed distributions exhibit a longer tail on one side than the other. Understanding skewness is critical because it reveals valuable information about the concentration of data points and can significantly influence statistical analyses and interpretations. For instance, skewed data can affect the reliability of measures like the mean, making the median a more robust alternative in certain scenarios. Moreover, recognizing skewness is essential in various fields, from finance (analyzing investment returns) to healthcare (understanding disease prevalence) and environmental science (evaluating pollution levels).
Overview: What This Article Covers
This article provides a comprehensive exploration of skewness, moving beyond a simple definition to cover its calculation, interpretation, different types, impact on statistical measures, and real-world applications. We will explore the relationship between skewness and other statistical concepts, examine practical examples, and discuss how to deal with skewed data in statistical analysis.
The Research and Effort Behind the Insights
This article synthesizes information from numerous statistical textbooks, research papers, and online resources. Each concept is supported by clear explanations, illustrative examples, and visual representations to ensure an accessible and informative understanding of skewness. The goal is to provide a robust, data-driven, and credible resource for anyone working with statistical data.
Key Takeaways:
- Definition and Core Concepts: A precise definition of skewness and its underlying principles.
- Types of Skewness: A detailed exploration of positive, negative, and zero skewness.
- Measuring Skewness: Methods for calculating skewness, including Pearson's moment coefficient of skewness and other approaches.
- Impact on Statistical Measures: How skewness affects the mean, median, and mode.
- Real-World Applications: Examples of skewness in various fields, demonstrating its practical relevance.
- Dealing with Skewed Data: Techniques for transforming skewed data for better analysis.
Smooth Transition to the Core Discussion
Having established the importance of understanding skewness, let's delve into its fundamental aspects, starting with its precise definition and the different types of skewness encountered in data analysis.
Exploring the Key Aspects of Skewness
1. Definition and Core Concepts:
Skewness quantifies the degree of asymmetry in a data distribution. A perfectly symmetric distribution has a skewness of zero. If the tail of the distribution is longer on the right (positive values are more spread out), the distribution is positively skewed (also called right-skewed). Conversely, if the tail is longer on the left (negative values are more spread out), the distribution is negatively skewed (also called left-skewed). The skewness value indicates the direction and magnitude of the asymmetry.
2. Types of Skewness:
-
Positive Skewness: The mean is greater than the median, which is greater than the mode. This indicates a concentration of data points at the lower end of the distribution, with a long tail extending to the right. Examples include income distribution (where a few high earners skew the mean upward) and house prices in a given area.
-
Negative Skewness: The mean is less than the median, which is less than the mode. This suggests a concentration of data points at the higher end, with a long tail extending to the left. Examples include exam scores where most students perform well (high scores clustered), with a few low scores creating the left tail.
-
Zero Skewness: The mean, median, and mode are equal. This signifies a perfectly symmetrical distribution, such as the ideal normal distribution.
3. Measuring Skewness:
Several methods exist for calculating skewness. The most common is Pearson's moment coefficient of skewness:
Skewness = 3 * (Mean - Median) / Standard Deviation
This formula provides a standardized measure of skewness, allowing comparisons across different datasets. Other methods include using the third standardized moment or non-parametric methods for ordinal data. Statistical software packages typically calculate skewness automatically.
4. Impact on Statistical Measures:
Skewness significantly influences the interpretation of common statistical measures:
- Mean: Highly sensitive to outliers; in skewed distributions, the mean can be misleading as it's pulled towards the longer tail.
- Median: A more robust measure of central tendency in skewed distributions, as it's less affected by outliers.
- Mode: Represents the most frequent value and can be useful in identifying the peak of the distribution, particularly in multimodal distributions.
5. Real-World Applications:
Skewness is relevant across many disciplines:
- Finance: Analyzing investment returns, risk assessment, portfolio management. Positively skewed returns indicate potential for high gains, but also higher risk.
- Healthcare: Understanding disease prevalence, analyzing patient demographics, evaluating treatment outcomes.
- Environmental Science: Studying pollution levels, analyzing climate data, evaluating ecological impacts.
- Economics: Analyzing income distribution, studying consumer behavior, predicting market trends.
Exploring the Connection Between Outliers and Skewness
The relationship between outliers and skewness is strong. Outliers, extreme data points significantly deviating from the rest of the data, often cause skewness. A single outlier in a small dataset can drastically alter the skewness, pulling the mean toward it and creating a longer tail.
Key Factors to Consider:
-
Roles and Real-World Examples: Outliers in income data (e.g., extremely high earners) create positive skewness. Outliers in test scores (extremely low scores) create negative skewness.
-
Risks and Mitigations: The presence of outliers can make statistical analysis unreliable. Techniques like winsorization (capping extreme values) or trimming (removing outliers) can mitigate their impact, though caution is needed as this can lead to information loss.
-
Impact and Implications: Misinterpreting skewed data due to outliers can lead to flawed conclusions and inaccurate predictions.
Conclusion: Reinforcing the Connection
The impact of outliers on skewness underscores the importance of carefully examining data for extreme values and considering their influence on the distribution's shape and the interpretation of statistical results. Understanding this connection is crucial for accurate data analysis and informed decision-making.
Further Analysis: Examining Outlier Detection in Greater Detail
Several methods exist for detecting outliers. Box plots visually highlight data points outside the interquartile range (IQR). Z-score analysis identifies outliers based on their distance from the mean in standard deviation units. Other techniques include using modified Z-scores or robust outlier detection methods.
FAQ Section: Answering Common Questions About Skewness
-
What is skewness? Skewness is a measure of the asymmetry of a probability distribution.
-
How is skewness calculated? Pearson's moment coefficient is a common method. Statistical software often provides automatic calculation.
-
Why is skewness important? It affects the reliability of statistical measures like the mean and reveals crucial information about data distribution.
-
How do I deal with skewed data? Transformations like logarithmic or square root transformations can reduce skewness. Winsorization or trimming can also be considered.
Practical Tips: Maximizing the Benefits of Understanding Skewness
-
Visualize your data: Histograms and box plots provide visual representations of skewness.
-
Calculate skewness: Use statistical software to compute the skewness coefficient.
-
Consider the median: In skewed distributions, the median is a more robust measure of central tendency than the mean.
-
Transform your data: If necessary, apply transformations to reduce skewness and improve the validity of statistical analysis.
-
Interpret results cautiously: Be aware of the potential influence of outliers on skewness and the interpretation of results.
Final Conclusion: Wrapping Up with Lasting Insights
Skewness is a fundamental statistical concept with far-reaching implications for data analysis and interpretation. By understanding its definition, types, measurement, and impact on statistical measures, researchers and analysts can draw more accurate conclusions and make informed decisions based on their data. The ability to detect and address skewness, along with the understanding of outliers' influence, is crucial for robust and reliable data analysis across numerous fields. Ignoring skewness can lead to misinterpretations and flawed conclusions, highlighting the importance of incorporating this knowledge into any statistical endeavor.
Latest Posts
Latest Posts
-
Inflexible Expense Definition
Apr 24, 2025
-
Inflationary Risk Definition Ways To Counteract It
Apr 24, 2025
-
Inflation Protected Security Ips Definition
Apr 24, 2025
-
Inflation Adjusted Return Definition Formula And Example
Apr 24, 2025
-
Inflation Swap Definition How It Works Benefits Example
Apr 24, 2025
Related Post
Thank you for visiting our website which covers about Skewness Definition In Statistics . We hope the information provided has been useful to you. Feel free to contact us if you have any questions or need further assistance. See you next time and don't miss to bookmark.
